Ideal Memory Reference Trace Collector
Memory behavior analysis is one of the most important technologies for architecture design, system software (i.e., OS, compiler) optimization, and application performance improvement. Moreover, multicore imposes higher demands to the memory system.
In their paper “Trace-driven memory simulation: A Survey” (ACM Computing Surveys, Jun., 1997), Richard A. Uhlig and Trevor N. Mudge proposed that an ideal memory trace should be complete, detail, and undistorted, as well as Portability, Fast, Inexpensive, Easy to operate etc.
Completeness: A complete trace includes all memory references made by each component of the system, including all user-level processes and the operating system kernel. User-level processes include not only applications, but also OS server and daemon processes.
Detail: An ideal detailed trace is one that is annotated with information beyond simple raw addresses. Useful annotations include changes in VM page-table state for translating between physical and virtual addresses, context switch points with identiers specifying newly-activated processes, and tags that mark each address with a reference type (read, write, execute), size (word, half word, byte) and a timestamp.
Undistortion: Traces should be undistorted so that they do not include any additional memory references, or references that appear out of order relative to the actual reference stream of the workload had it not been monitored.
Portability: Portability, both in moving to other machines of the same type and to machines that are architecturally different is important.
Other characteristics: An ideal trace collector should be fast, inexpensive and easy to operate.
Many approaches such as simulation and instrument and hardware snooping can collect memory trace. However, they are usually subject to time, accuracy, and capacity constraints.
Overview of the HMTT
We designed and implemented the Hybrid Memory Trace Toolkit(HMTT), an approach which integrates hardware and software to track and analyze physical or virtual memory trace of OS kernel, libraries, and applications in real systems.
The HMTT is nearly an ideal memory trace collector:
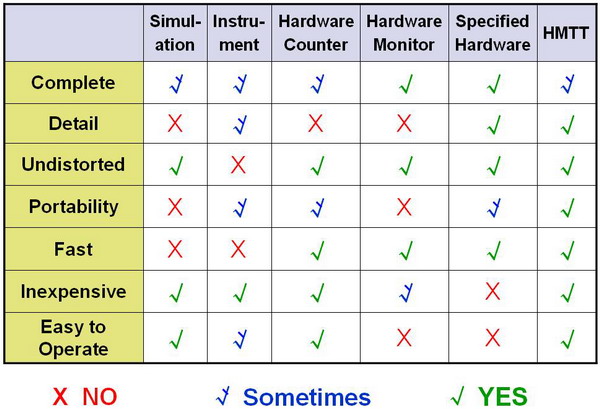
Complete: The HMTT is able to track complete memory reference trace from the real systems, including applications, libraries, kernel. It is also able to track memory trace from different level of memory hierarchy. The HMTT can only track the cache filtered trace for analysis of L2/L3 cache, memory controller, and memory system performance, with no slowdown. When disabled cache, it can track the whole trace, from L1 cache to DRAM, with a slowdown factor of 10~100.
Detail: The trace collected by the HMTT include physical address, virtual address, r/w, timestamp, process’ pid, page_table changes, and kernel entry/exit tags etc.
Undistorted: There are almost no additional references expect synchronizing the HMTT with page_table changes, which will introduce less than 1% additional references and about 1% addtional execution time.
Portability: The hardware borad of HMTT is plugged in a DIMM slot which is commonly used in contemporaneity computers. The software components work on Linux now, and can be ported to other OSs easily.
Fast: There is no slowdown when collecting cache filtered trace. The slowdown factor is about 10~100 when disable cache in order to collect whole trace. However, it is still competitive to other approaches, such as simulation, instrument etc.
Inexpensive: The HMTT is quite easy and cheap to implement. Our hardware implementation costs less than $1000.
Easy to operate: The HMTT provides several toolkits to auto-generate and auto-analyze memory reference trace.
Limitations: The trace size is quite large because we have not adopt any compression approaches yet. Thus, most applications’ trace-generation rate is about 30~50MB/s. Moreover, if disable the cache, the trace size will be magnified. So, The HMTT provides a toolkit to instrument codes into specified functions or loops. We suggest that only collecting trace of the functions or loops which we are interested in would reduce trace size when disable the cache. Moreover, it can only listen to one DIMM at a time because the Chip Select (CS) signal is not shared. But we can use large capacity memory chip to overcome this limitation.
This figure shows the comparison with other approaches:

Features of the HMTT
The HMTT provides memory reference trace. Moreover, it also provides online and offline memory trace analysis, e.g.
Online Analysis:
Memory bandwidth statistic;
Page reuse distance calculation;
Hot pages collection;
Offline Analysis:
Virtual or physical memory reference pattern of an individual process (including kernel);
Stream characteristic analysis;
Cache/TLB performance analysis.