The latest version of HMTT available is HMTT v3_4.
The HMTT’s Framework
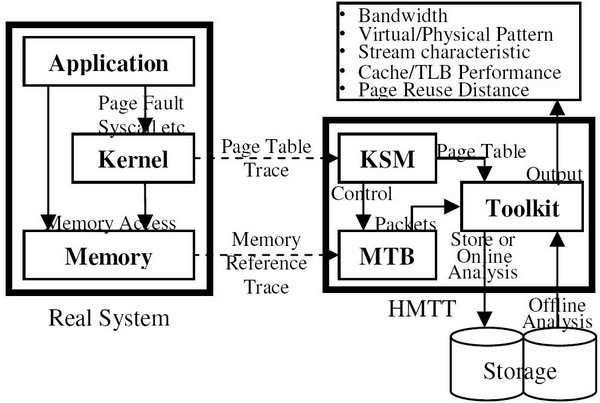
We designed and implemented the Hybrid Memory Trace Toolkit(HMTT), an approach which integrates hardware and software to track and analyze physical or virtual memory trace of OS kernel and other applications in real systems. The HMTT we implemented consists of a Memory Trace Board (MTB, an FPGA board) plugged in a DIMM slot, a Kernel Synchronization Module (KSM) which synchronizes system page table with memory trace, and a trace capture and analysis toolkit (See the following figure). The MTB snoops into the memory bus, tracks memory reference, and send out to network, while the KSM is triggered to record page table updates when page fault occurs and synchronize with the MTB if necessary. The toolkit provides programs to capture different formats of memory trace packets from Gigabit Ethernet and programs to analyze memory bandwidth, reuse distance, cache/TLB miss, and stream analysis online/offline. The HMTT is transparent to applications and system software and has very little overhead and memory pollution.
The following figure presents HMTT’s framework:

The Memory Trace Board (MTB)
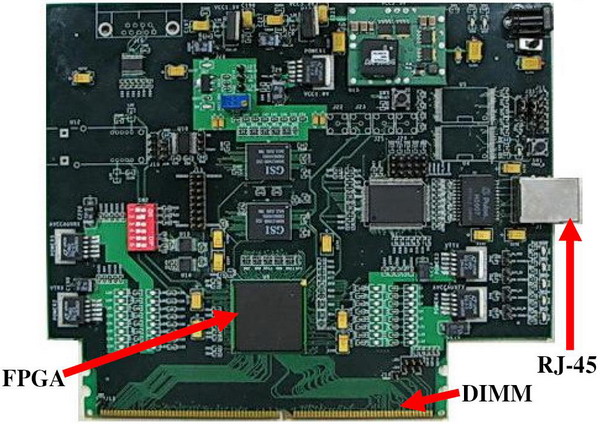
The MTB is an FPGA board, plugged in an idle DIMMslot. It listens when memory access command signals are sent to DDR SDRAM through shared bus. MTB acquires the same commands as other DDR SDRAM, and forwards the commands to an inner state machine to get address and operation. The output of state machine is a tuple <address, r=”” w,=”” timestamp=””>. The raw tuple could be sent to GbE directly. MTB is also able to process the raw tuple to obtain bandwidth, hot pages, reuse distance, and sends them to GbE. MTB is system-independent, and has no influence to system running.
The following figure presents the Memory Trace Board (MTB):

The Kernel Synchronization Module (KSM)
The KSM for Linux comprises of two modules and one kernel patch file. One module is mentioned above, while another provides an interface like printk for kernel to record page table data to a user buffer. The kernel patch file is less than 30 code lines which modifies two files — entry.S and pgtable.h (pgtable.h may be different depending on the CPU type).
The patch file modified set_pte_at macro in the pgtable.h file (pgtable-2level.h in i386 platform) to record every page table change. The kernel ultimately calls "set_pte_at" at each page fault to update the application's page table.
The patch for entry.S is one alternative. This patch inserts a few codes at SAVE_ALL, RESTORE_REGS and two other points to send tags to the MTB when kernel-enter and kernel-exit occur. It is useful for analyzing full system memory behaviors, including OS kernel, and can be removed when an analysis of the only user application's behavior is needed.
The Toolkit
The Toolkit includes a zero-copy driver for Intel E1000 GbE NIC, and several analysis programs. A computer with GbE NIC is able to run the toolkit (the zero-copy driver may need modified).
The toolkit provides programs to analyze memory bandwidth and reuse distance online. It extracts the trace data from packets and performs the corresponding process, before eventually discarding the packets. The toolkit also provides offline analysis programs that can analyze memory trace and page table trace simultaneously. The latter is used to reconstruct current physicalvirtual mapping table, while the programs use physical memory trace to query the table to retrieve the pid and virtual address. When meeting a synchronization tag in the memory trace, the mapping table is also updated to guarantee consistency. Their outcomes could be virtual memory trace, stream information, cache/TLB miss statistic, kernel impact on memory behavior, application page table statistic, and so on.