Research with the HMTT
The HMTT is initially designed for research Dynamic Self-organized computer Architecture based on Grid-components(DSAG).The DSAG,based on the concepts of decoupling,reconfigurable,and dynamical,is proposed by Prof.Fan and Prof.Chen.
It seems to aggravate the“Memory Wall”problem that the DSAG decouples CPU and memory for sharing, reconfiguration, and cutting cost. So, there are many issues should be studied and verified. The memory behaviors analysis of diverse workloads is especially significant to the DSAG idea. Thus, we designed and implemented the HMTT.
In fact, the HMTT is independent of the DSAG. It is a universal memory trace collect and analysis toolkit, and can be adopted for other purposes.
The following sections present an example of memory behavior analysis.
Experimental Setup
Here, we present an example analysis of memory behaviors of real workloads, which run on a real system with the HMTT. The machine’s configuration and the workloads are listed in the following tables:

Note: In this example, we focused on analysis of memory system,including Cache, TLB, memory etc. So, we adopted cache flitered trace.
Memory Reference Trace Information
We collected memory reference trace of total 28 workloads(f95 failed to compile 178.galgel). The first 4 columns of the following list present general trace information of the workloads.
NUM: Total trace number in billion. Most workload’s trace number are less than 10 billions. However, 179.art reaches nearly 29 billions.
Size: Total trace size in GB. Most workload’s trace size are less than 20GB. 179.art even reaches nearly 130 GB. The total trace size of all workloads is about 760GB.
The trace size is quite large because we have not adopt any compression approaches yet. In another way, only tracking trace of the functions or loops which we are interested in would reduce trace effectively.
NBW: Transmission Bandwidth through GbE. Most applications’NBW is about 30~50MB/s. So, 1000Mb/s is sufficient for capturing all traces. However, one disk may not be able to afford the bandwidth. Fortunately, contemporary computers can be setup in BIOS to support RAID, and as such, we can use two disks to form a RAID.
Miss: When the protected mode is enabled in the X86 platforms,MMU is the required path to access memory. Thus, either kernels or user programs must use virtual address to access memory. This means that an accessed physical page must be mapped to at least one virtual page.If the query result is null when indexing a physical address in the physical-virtual mapping table, then inconsonance occurs and we say that this is a miss. We see that most miss rate of applications are less than 0.5%. At 1~3 %, desktop applications behaviors are not so good because much more processes live in desktop environments. The OS kernel memory management also seems to be somewhat chaotic.Nevertheless, the miss rates are still acceptable.
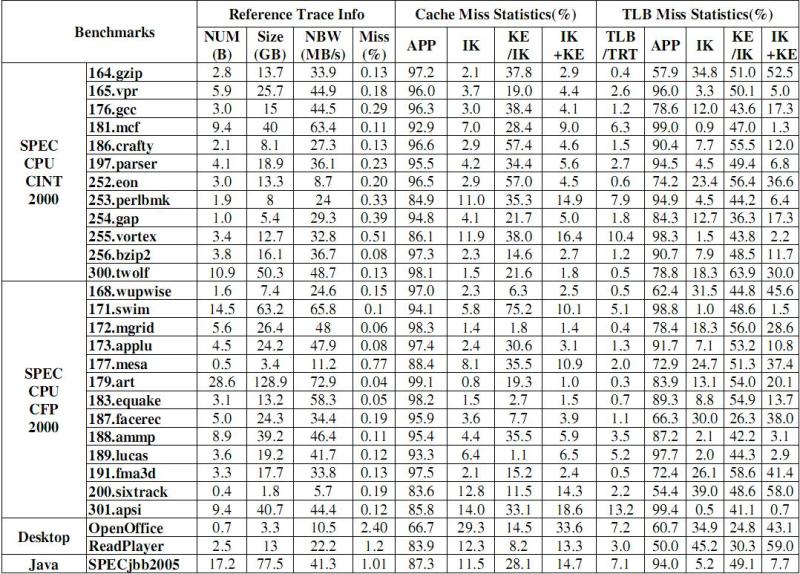
NUM = Memory Reference Trace Number(Billion); Size = Trace Size(GB);
NBW = Transmission Bandwidth through GbE;
Miss = Miss Rate of Translating Phy_addr to Virt_addr;
APP = Applications; IK = In Kernel; KE = Kernel Exit;
TRT = Total Reference Trace
Cache/TLB Performance
Cache and TLB are two of the most important topics in micro architecture fields. Previous research works show that OS kernel will influence applications performance in varying degrees, including Cache/TLB performance. Using SimOS, Barroso [1], Redstone [2] et al. stated that the OS in server applications accounts for about 30%~70% overhead. With SimOS, Rosenblum et al. [3] took further research on the impact of kernel on Cache/TLB performance. With the HMTT provided cache/TLB miss reference trace, we proposed an approach to evaluate the impact of OS kernel on Cache/TLB performance on real X86 platforms.
We proposed a Memory-to-Cache/TLB reverse model and an algorithm. With the model and the algorithm, we can use the HMTT’s trace to identify the kernel impact of cache/TLB performance.
We believe that the kernel impact should be divided into two parts: (1) the Cache/TLB miss in the kernel mode; (2) user programs refilling the cache line or TLB entries evicted by kernel data, after kernel exiting. As shown in the above table, we use “In Kernel(IK)” and “Kernel Exit(KE)” to identify them.
Cache/TLB Performance Analysis:
Through the above table, we can see that the IK cache misses in most SPEC CPU2000 benchmarks are less than 10%, with values of around 1~6%. Moreover, IK cache misses in SPECjbb 2005 and realplayer are about 11%, but are near 30% in OpenOffice. Meanwhile, KE cache misses distribute uncertainly, from 1% ~ 75% of IK misses.The sum of IK and KE cache misses accounts for quite a proportion of total cache misses.
TLB miss also incurs cache miss. The table shows that the cache misses that are caused by TLB misses are distributed from 0.2% to 13%. 255.vortex and 301.apsi are considered special compared to other benchmarks,and theirs are more than 10%. There are 13 benchmark’s IK TLB misses accounting for more than 10%, and realplayer has even more than 45%. All benchmarks’ KE TLB misses are above 20% of the IK, and most fall within 40% ~ 60%. From these, we can summarize that TLB is more kernel-sensitive than the cache.
Memory Bandwidth
Multicore imposes higher demands to the memory system. Lack of adequate memory bandwidth will limit application performance.
Usually, mean memory bandwidth is one of the measurements used to evaluate an application’s memory requirements. However, memory reference frequency cannot always be the same as there may be burst access in a short interval. Here, we defined an application’s burst bandwidth as the top 10% bandwidth in short intervals during the entire execution.
The following figure shows the mean bandwidth and burst bandwidth of 35 workloads:
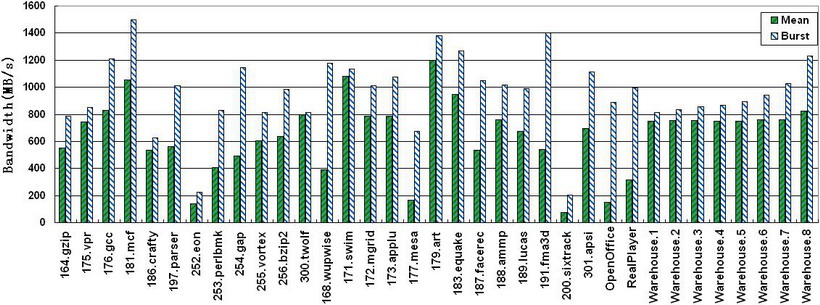
As shown in the figure, The burst bandwidths are more than the mean bandwidths, varying from 2% to 500%. Meanwhile, the mean bandwidths of SPECjbb2005 from one warehouse to seven warehouses increased modestly by about 1.9%, but the burst bandwidths increase 26.3%. Therefore, using just the mean bandwidth to measure applications bandwidth will deceive their burst behaviors.
Memory Access Phase
A number of programs operate as a series of phases, where each phase may be very different from the others. Sherwood et al.[4] proposed efficient run-time phase tracking architecture based on SimpleScalar, while Shen et al.[5] used ATOM to generate the data reference trace for the Locality Phase Prediction.
The HMTT is able to provide data for memory reference phase analysis. It accumulates memory access in a specified interval which can be configured from 1us to 1s. Moreover, it is triggered to output the memory reference number when it reaches the interval end. The data can then be used for offline memory reference phase analysis. As this analysis is simple and offline, it can easily enhance the HMTT’s ability to send an interrupt to the CPU when triggered.

The follow figures show the memory reference phase of 255.vortex and SPECjbb2005 with 8 warehouses: (Click here to view more applications’ phase figures)
Page Reuse Distance
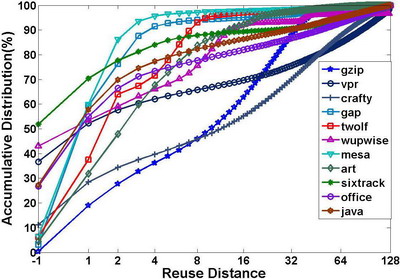
Reuse distance reveals patterns in program locality. However, its calculation usually costs both time and space.Ding [6] proposed an efficient algorithm which takes O(loglogM) time per access and O(logM) total space, where M is the size of the program data. The HMTT has a RDSA-LRU which is able to calculate page level reuse distance online. The reuse distance will not change when it converts a physical page to a virtual page, and for this reason, we use physical pages to calculate their reuse distance.
|
|
As shown in the left figure, we chose several typical benchmarks to represent all benchmarks classified by their page reuse distance characteristic (the -1 in axis-x stands for reuse distance greater than 128 ).
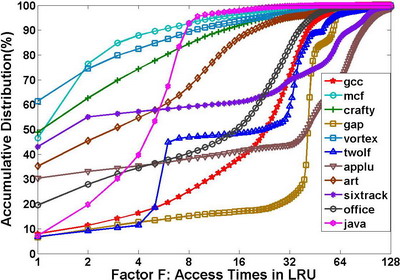
We investigated an individual page’s reuse distance further. When a page’s reuse distance is less than 128, it means that the page is already in the LRU stack, otherwise, the page is not in stack and will be loaded to reside until it is evicted. We defined a factor F to evaluate how many times a pages will be accessed when it stays in the LRU stack.
Define: F = Nrd<128 / Nrd>=128 , where N means Number of.
The right figure shows the F factor distribution of several benchmarks.
Stream Characteristic Analysis
Stride memory accesses are defined by the equation Xn = Xn-1 + C, where C is a constant and Xn is the nth reference in the sequence. The sequence forms a stream, and many optimization approaches can be applied on streams, such as prefetching and vector loads. Tushar Mohan et al. [7] defined a metric to quantify the spatial regularity of an application based on stream. The metric refers to the fraction of all references that belong to some stream.Here, we use the term“Stream Cover Rate (SCR)”, which is easy to understand, instead of “spatial regularity”. Form the explanation above, we can say that SCR implies the potential performance improvement of applications.
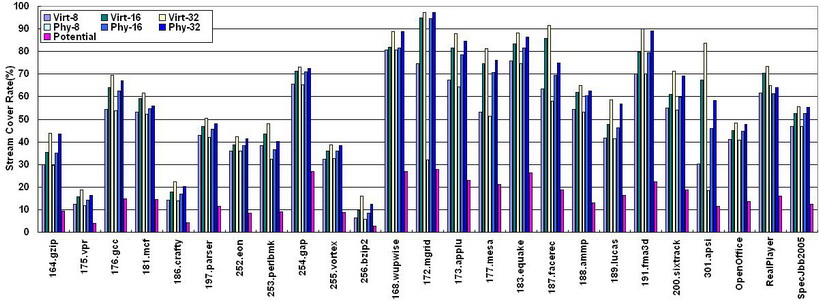
This figure shows physical and virtual SCR under different window sizes. Choosing an appropriate window size can reduce hardware implementation complexity. As can be seen, most applications achieve more than 40% SCR under a 32-size window. The SCR reduced by page mapping can be ignored. Most streams are within one page. As detecting a stream needs three references which cannot be used for prefetching, we removed those references in streams in order to obtain a net potential performance improvement. The last bar of each benchmark shows that net improvement can be achieved. Moreover, most benchmarks’memory performance can benefit by more than 10% from hardware stream prefetching.
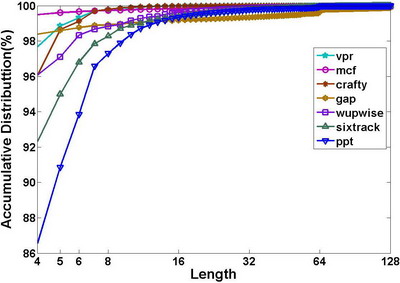
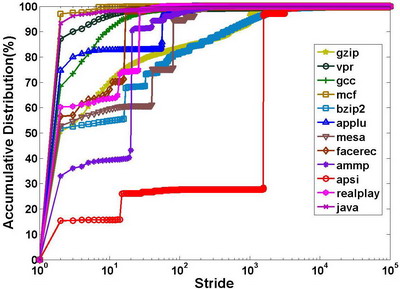
However, the improvements seem to be not so aggressive compared to high SCR. As such, we investigated each stream of the benchmarks. In doing so, we considered the stream’s length, stride, and access interval. The following 4 figures present the stream statistic data of some benchmarks:
|
|
|
|
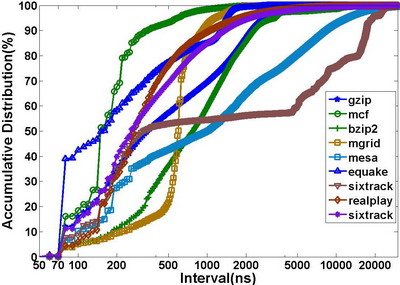
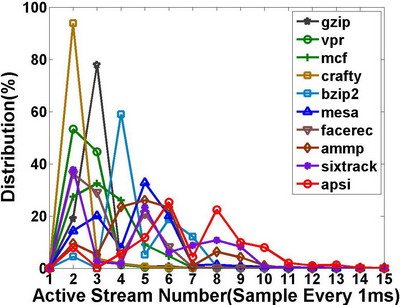
From these figures, we can find that most streams have lengths less than 10, and that most streams’ strides are also less than 10. We think that this is due to the impact of cache hits, with the short stride indicating the same phenomenon in the cache. However, the short length implies that the cache absorbs parts of a long stream to make the stream broken.
About 90% mean intervals fall between 100ns~10us, multiple times of one memory access latency. Therefore, the hardware has enough time to perform prefetching. Moreover, the number of active streams at most time is less than 10, so the hardware storage for the stream table becomes small.
However, multi-processing may reduce the SCR. It is our future interesting of the stream analysis on multicore platform.
Page Fault Analysis
The SCR of 301.apsi reduces more than 20% from virtual to physical stream detecting because most strides are more than 64B*1000 The S 64KB,covering several pages.OS effects may avoid this . So, we also analyzed the page faults of all workloads.
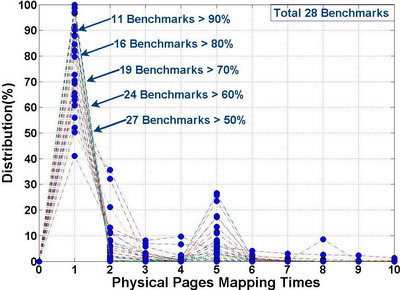
As the figure shown, we found most physical pages are mapped to virtual pages only once during application’s entire execution. So OS can pre-map a region where both virtual and physical addresses are linear. OS would allocate memory from this region when application calls malloc. If the region has no enough space, OS could choose either reclaiming free space for the region or allocating in common method.
References
L. A. Barroso, K. Gharachorloo, E. Bugnion, “Memory System Characterization of Commercial Workloads”,Proceedings of the 25th International Symposium on Computer Architecture, June 1998.
Mendel Rosenblum, Edouard Bugnion, Stephen Alan Herrod, Emmet Witchel, and Anoop Gupta. “The Impact of Architectural Trends on Operating System Performance”. SOSP, December 1995, 285-298.
Timothy Sherwood, Suleyman Sair, Brad Calder, “Phase Tracking and Prediction”, Proceedings of the 30th International Symposium on Computer Architecture, June 2003.
Xipeng Shen, Yutao Zhong, and Chen Ding,“Locality Phase Prediction”, (ASPLOS XI), Boston, MA, USA, October 2004, 165–176.
C. Ding, Y. Zhong, “Predicting Whole-Program Locality through Reuse Distance Analysis”, Proceedings of the 2003 ACM SIGPLAN Conference on Programming Language Design and Implementation, June 2003.
Tushar Mohan, Bronis R. de Supinski, Sally A. McKee, Frank Mueller, Andy Yoo, Martin Schulz, “Identifying and Exploiting Spatial Regularity in Data Memory References”, Supercomputing Conference 2003, November 2003.
